Adaptive simulation of Nooru-Mohamed test

Geometry of test 
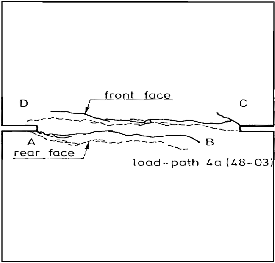
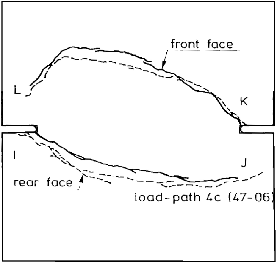
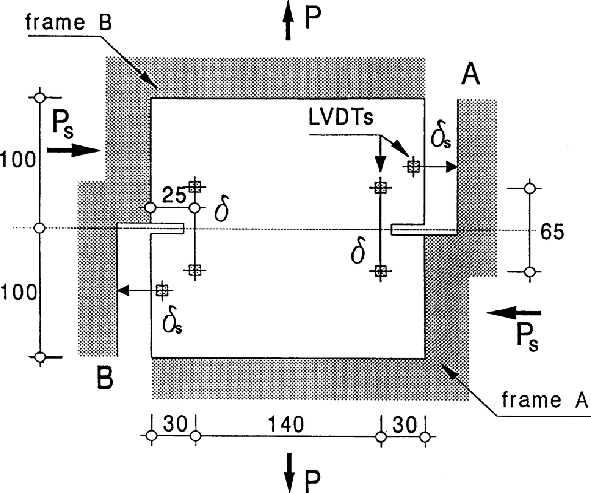
This double-edge-notched (DEN) specimen that was tested by Nooru-Mohamed [1] is a nice example of damage propagation along a curved trajectory.

The specimen can be subjected to a combination of shear and tension (or compression). Nooru-Mohamed performed his experiments for a number of loading paths, some of them even nonproportional. Among the most interesting loading scenarios were paths 4a, 4b and 4c. During the first stage, the specimen was loaded by an increasing ``shear'' force, Ps, while keeping the ``normal'' force, P, at zero. After reaching a certain load level, the type of loading was changed. During the second stage, the force Ps was kept constant and the test was controled by increasing the ``normal'' displacement $\delta$. For path 4a the change of loading occured at Ps=5 kN, for path 4b at Ps=10 kN, and for path 4c at the maximum shear force that the specimen could sustain, Ps=Psmax=27.5 kN.

In all the cases, the failure pattern consisted of two macroscopic cracks propagating from the notches in an inclined direction. For path 4a, these cracks were almost horizontal and close to each other ( Fig. 2 top ), while for path 4c they were highly curved and farther apart ( Fig. 2 bottom ).

Failure of the DEN specimen under loading paths 4a and 4c has been simulated using the nonlocal version of the anisotropic damage model (MDM) described in [2]. The material parameters have been deduced from the data provided in [1]: compressive strength measured on cubes fc=46.24 MPa for path 4a and fc=46.19 MPa for path 4c, and splitting tensile strength fs=3.67 MPa for path 4a and fs=3.78 MPa for path 4c. The compressive strength is slightly above the value that corresponds to concrete C-30 according to the CEB-FIP Model Code. Interpolation between the values of tensile strength and Young's modulus corresponding to concretes C-30 and C-40 gives ft=3 MPa and E=29 GPa. The value of tensile strength is in agreement with the empirical formula ft=0.8fs. The fracture energy is considered by the same value as in \cite{Pri00}, i.e., Gf=110 J/m2, and the interaction radius is set to R=5 mm.

The adaptive analysis with damage level (defined as maximum principal value of damage tensor) as error indicator has been used.
The default mesh size for elastic regions was prescribed, inside damaged regions linear interpolation of mesh density was performed between
two characteristic values of damage indicator (omega_0=0.6, h0=8 mm, omega1=0.8 and h1=2.8 mm).
Analysis required 13 remeshings for path 4a and 23 remeshings for path 4c.

Test
Experimental crack pattern
Principal strain
Damage indicator
4a


Clik here: Animation on evolving grid

Clik here: Animation on evolving grid
4c


Clik here: Animation on evolving grid

Clik here: Animation on evolving grid

The final damage and principal strain profiles are shown in Fig 2 . It is clear that for both loading paths the numerical prediction is in an excellent agreement with the experimental results. Even the highly curved cracks generated by path 4c are reproduced very accurately.
The load-displacement curves are plotted in Fig.3 . Leaving aside the difference between the experimental and numerical compliances, one can say that the agreement between the test and the simulation is very satisfactory. For an more discussions see [3].


Fig. 3: Load displacement diagrams

[1] Nooru-Mohamed, M.B.: Mixed-mode fracture of concrete: An experimental approach, PhD thesis, Delft University of Technology, The Netherlands, 1992.
[2]Jirasek, M.:Comments on microplane theory, in G. Pijaudier-Cabot, Z. Bittnar, and B. Gerard (eds), Mechanics of Quasibrittle Meterials and Structures, 55-77, Hermes Science Publications, Paris, 1999.
[3] B. Patzák and M. Jirásek. Adaptive simulation of quasibrittle failure . In N. Bicanic, R. de Borst, H. Mang, and G. Meschke, editors, Computational Modelling of Concrete Structures, Proceedings of the EURO-C Conference, pages 109--118, St. Johann im Pongau, Austria, 2003. A.A. Balkema Publishers.

This page is part of the OOFEM project documentation (www.oofem.org)
(c) 2003 Borek Patzak, e-mail: info@oofem.org